Trend lines and how to use them in Algorithmic Cryptocurrency trading
Tue Jun 06 2023
Trend lines can be a useful tool in determining an asset-s general direction and predicting key points on a chart. It is however not without its limitations, and using them in algorithmic cryptocurrency trading is not so straightforward. Read more.

In regular trading as well as algorithmic cryptocurrency trading, determining and reacting to trends is essential. One way traders determine trends is by using trend lines. They assist traders in recognizing patterns, understanding price fluctuations, and making informed decisions. This article examines the role of trend lines in cryptocurrency markets, their types, their application, and their limitations.
The Mechanics of Trend Lines
Trend lines are the backbone of technical analysis in financial markets, offering insights into price movements and market trends. They are diagonal lines drawn on financial charts, connecting specific data points, and their use spans various markets - stock, fiat currency, derivatives, and cryptocurrency.
Classifications of Trend Lines
Trend lines are primarily divided into two categories based on their slope:
- Ascending (Uptrend) Line: This trend line connects two or more low points, moving from a lower to a higher chart position.
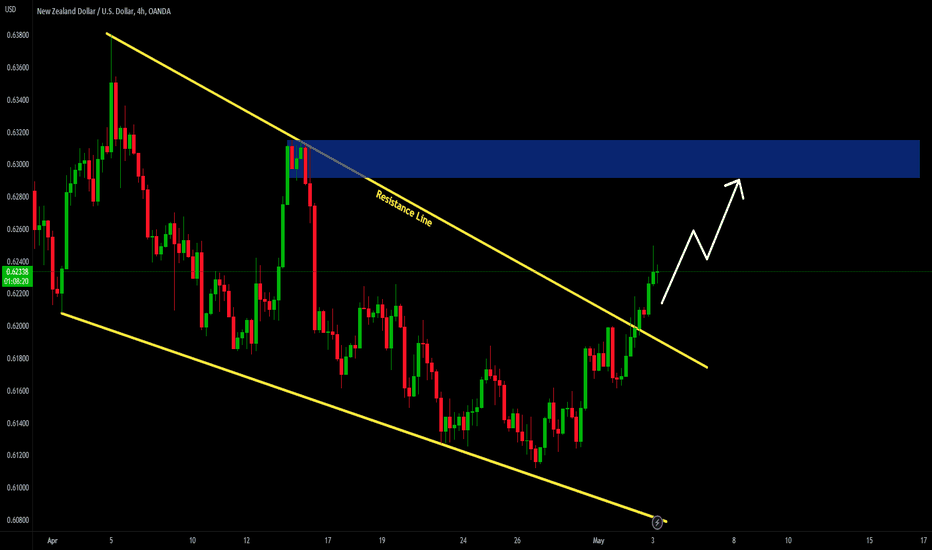
- Descending (Downtrend) Line: Conversely, this trend line is drawn from a higher to a lower chart position, connecting two or more high points.
The distinction between the two lies in the selection of the points used to draw them. The lowest points in the chart depict an uptrend, while the highest points represent a downtrend.
Practical Application of Trend Lines in Trading
Trend lines allow traders to analyze the price trajectory, test the prevailing market trend, and attempt to predict future important levels. As long as the trend line remains unbroken, it is seen as valid, even if it undergoes multiple tests.
Trend lines are often applied to financial charts, providing a visual representation of market supply and demand. Increasing buying force is indicated by upward trend lines, while downward trend lines suggest the opposite. Nonetheless, trading volume should also be analyzed to avoid false impressions of demand.
Understanding Support and Resistance Levels through Trend Lines
Trend lines play a significant role in recognizing support and resistance levels, essential aspects of technical analysis. The support level is depicted by an uptrend line, and the price is unlikely to drop below it. On the other hand, the downtrend line represents the resistance level, above which the price is unlikely to rise.
The market trend may be deemed invalid if the support and resistance levels are breached. Often, the market tends to alter direction when these key levels fail to maintain the trend.
While it is technically possible to connect any two points on a chart with a trend line, a valid trend line should connect at least three points. The initial two points define a potential trend, while the third point tests its authenticity. A trend that touches the line three or more times without breaching it can be regarded as valid.
Significance of Scale Settings in Trend Lines
In financial charts, the scale represents how the price change is displayed. The two commonly used scales are arithmetic and semi-logarithmic. Arithmetic charts express change evenly as the price fluctuates, while semi-logarithmic charts express variations in terms of percentage. It is crucial to consider the scale settings when drawing trend lines, as different chart types may yield different trend lines.
Limitations of tend-lines
Despite their usefulness, trend lines are not infallible. In fact, due to their arbitrary nature, trend lines are not commonly used in crypto trading bots. When creating an algorithmic strategy, traders are often required to input a precise configuration logic that the trading bot can repeatedly perform. Without a clear logic, trading bot are unable to function properly, it at all.
The issue with using trend lines in algorithmic trading, is that their setup is not replicable on a configuration that’s meant to execute with the same parameters. That being said though, on Æsir, our algorithmic cryptocurrency trading platform, users have a wide variety of choices on how to implement a similar logic or strategy, without having to actually draw trend lines on a chart.
In addition to that, trend lines are somewhat subjective, as their accuracy depends on the choice of points used for drawing. Therefore, they should be used in combination with other charting tools and indicators like Ichimoku Clouds, Bollinger Bands (BB), MACD, Stochastic RSI, RSI, and moving averages.
In algorithmic cryptocurrency trading, integrating multiple technical analysis techniques and fundamental analysis helps reduce risks and enhances decision-making, leading to potentially better trading outcomes.
The best way is to learn by doing, so why not take Æsir for a spin. See you around!