Understanding the Stochastic Relative Strength Index Indicator for Algorithmic Cryptocurrency Trading
Tue Apr 25 2023
Stochastic RSI, is a technical indicator used to determine whether an asset is overbought or oversold, and is a commonly used indicator in algorithmic cryptocurrency trading.
Stochastic RSI, also known as StochRSI, is a technical analysis tool used to determine whether an asset is overbought or oversold, as well as to identify current market trends. It is a derivative of the standard Relative Strength Index (RSI) and is considered an indicator of an indicator. StochRSI is frequently used by stock traders but can also be to cryptocurrency as as part of a manual or algorithmic trading strategy
How StochRSI Works
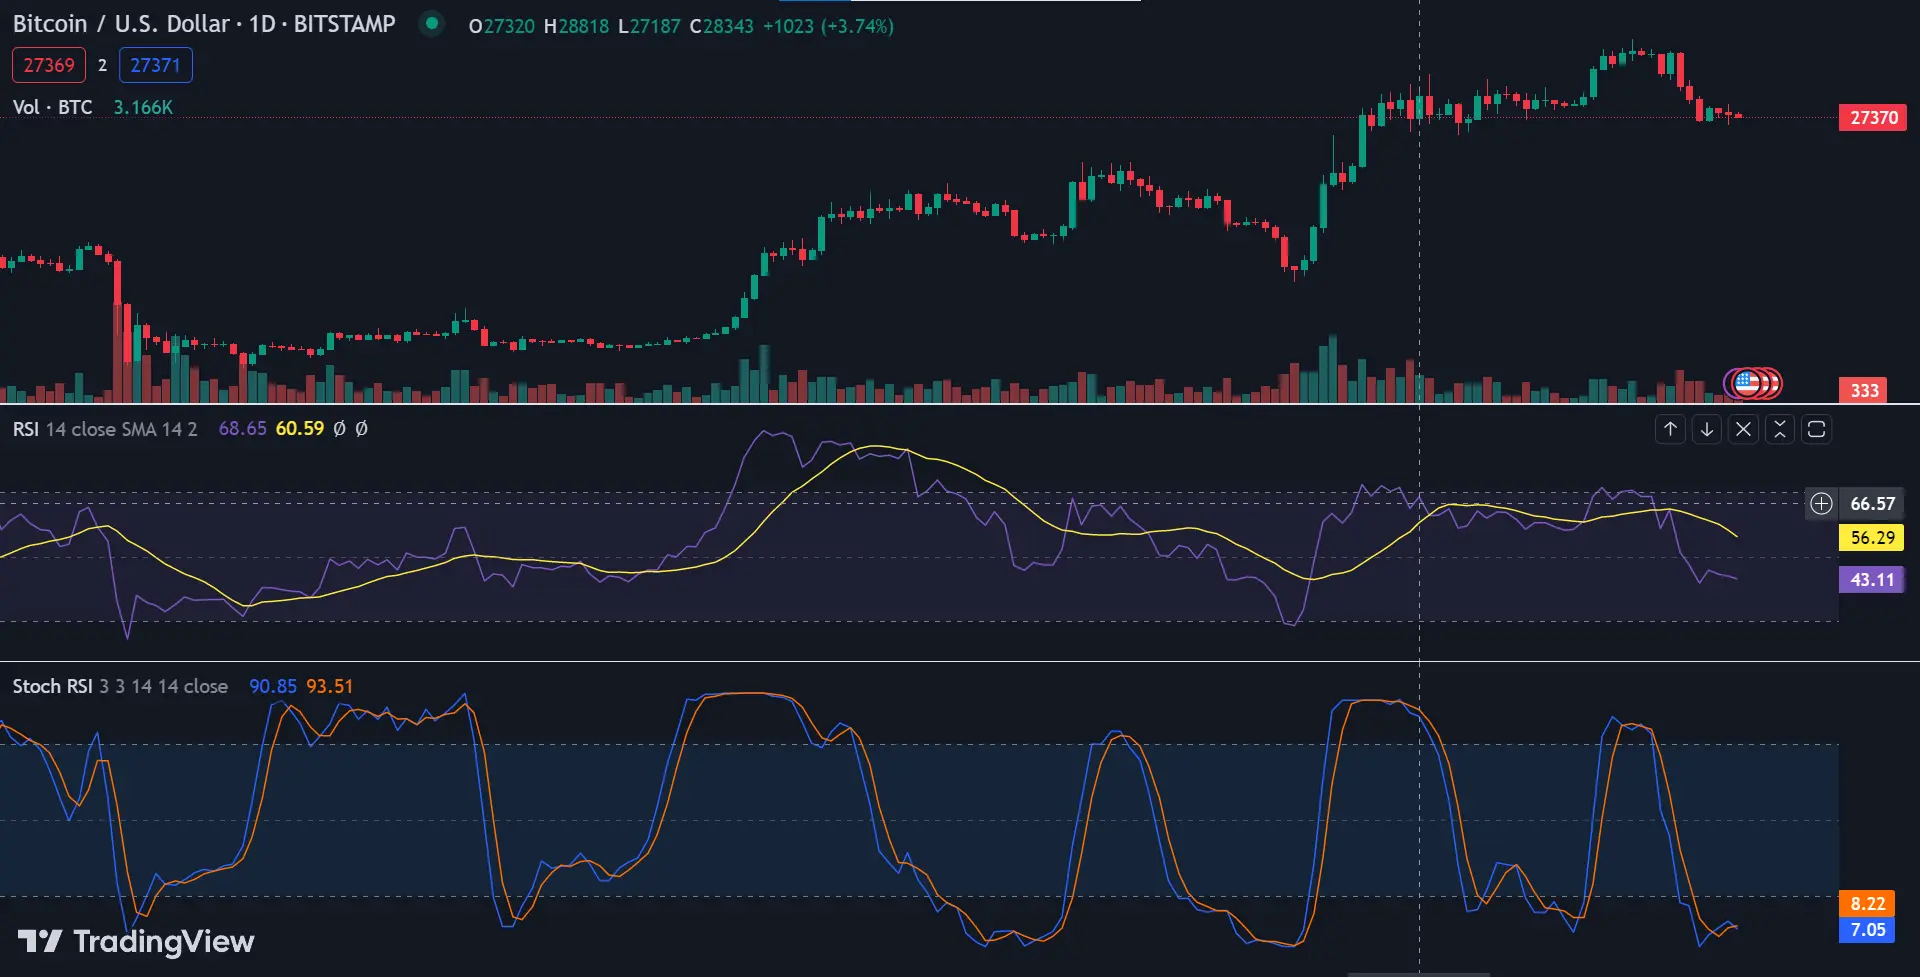
The StochRSI indicator is generated from RSI by applying the Stochastic Oscillator formula. The result is a single numerical rating that swings around a centerline (0.5), within a 0-1 range. However, there are modified versions of the StochRSI indicator that multiply the results by 100, so the values range between 0 and 100 instead of 0 and 1.
The standard Stochastic Oscillator formula considers an asset’s closing price along with its highest and lowest points within a set period. However, when the formula is used to calculate the StochRSI, it is directly applied to the RSI data (prices are not considered).
Just like the standard RSI, the most common time setting used for the StochRSI is 14 periods. The 14 periods involved in the StochRSI calculation are based on the chart time frame. The periods could be set to days, hours, or even minutes, and their use varies significantly from trader to trader. A 20-period setting is another fairly popular option for the StochRSI indicator.
Using StochRSI
The StochRSI indicator takes on its greatest significance near the upper and lower bounds of its range. Therefore, the primary use of the indicator is to identify potential entry and exit points, as well as price reversals.
A reading of 0.2 or below indicates that an asset is probably oversold, while a reading of 0.8 or above suggests that it is likely to be overbought. Readings that are closer to the centerline can also provide useful information in regards to market trends.
When the centerline acts as a support and the StochRSI lines move steadily above the 0.5 mark, it may suggest the continuation of a bullish or upward trend - especially if the lines start to move toward 0.8. Likewise, readings consistently below 0.5 and trending toward 0.2 indicate a downward or bearish trend.
StochRSI vs. RSI
Both StochRSI and RSI are banded oscillator indicators that make it easier for traders to identify potential overbought and oversold conditions, as well as possible reversal points. However, the standard RSI is a relatively slow-moving indicator that produces a small number of trading signals.
The application of the Stochastic Oscillator formula to the regular RSI allowed the creation of the StochRSI as an indicator with increased sensitivity. Consequently, the number of signals it produces is much higher, giving traders more opportunities to identify market trends and potential buying or selling points.
In other words, the StochRSI is a fairly volatile indicator, and while this makes it a more sensitive TA tool that can help traders with an increased number of trading signals, it is also riskier because it often generates a fair amount of noise (false signals).
StochRSI in Algorithmic Cryptocurrency Trading
Because of the simple nature of the signals it generates, the StochRSI indicator lends itself quite well to algorithmic trading. An algorithmic trading strategy for the StochRSI indicator would take advantage of the 0.2 and 0.8 points to generate buy or sell signals. With Æsir, this logic can be easily built by using the Technical Analysis layer. However, because the StochRSI tends to generate a more signals than the regular RSI, it should be used with caution.
Using StochRSI in parallel with other indicators to confirm the signal is recommended. Other oscillators may be used, ot you can use other indicators entirely - both approaches are valid.
It is also important to keep in mind that the cryptocurrency markets are more volatile than traditional ones and may generate an increased number of false signals. Therefore, traders should exercise caution when using this indicator in algorithmic cryptocurrency trading.
With Æsir you can create algorithmic crypto trading strategies that run in paper trading mode for free, to test different scenarios without risk. Start today and learn how to master the StochRSI indicator!