Understanding the Relative Strength Index Indicator for Algorithmic Cryptocurrency Trading
Sun Apr 23 2023
The RSI indicator is a momentum oscillator that measures the magnitude of price movements as well as the speed (velocity) of these movements and is frequently being used in algorithmic cryptocurrency trading
When it comes to algorithmic cryptocurrency trading, technical analysis (TA) is an important tool used by traders to predict future trends and price action. From traditional to cryptocurrency markets, most traders rely on specialized tools to perform these analyses, and the Relative Strength Index (RSI) is one of them.
What is the Relative Strength Index Indicator?
The Relative Strength Index (RSI) is a TA indicator developed in the late 1970s as a tool that traders could use to examine how a stock is performing over a certain period. It is, basically, a momentum oscillator that measures the magnitude of price movements as well as the speed (velocity) of these movements. The RSI can be a very helpful tool depending on the trader profile and their trading setup, and is frequently being used in algorithmic cryptocurrency trading along with the MACD indicator
The RSI indicator was created by J. Welles Wilder in 1978. It was presented in his book New Concepts in Technical Trading Systems, along with other TA indicators, such as the Parabolic SAR, the Average True Range (ATR), and the Average Directional Index (ADX).
How does the RSI indicator work?
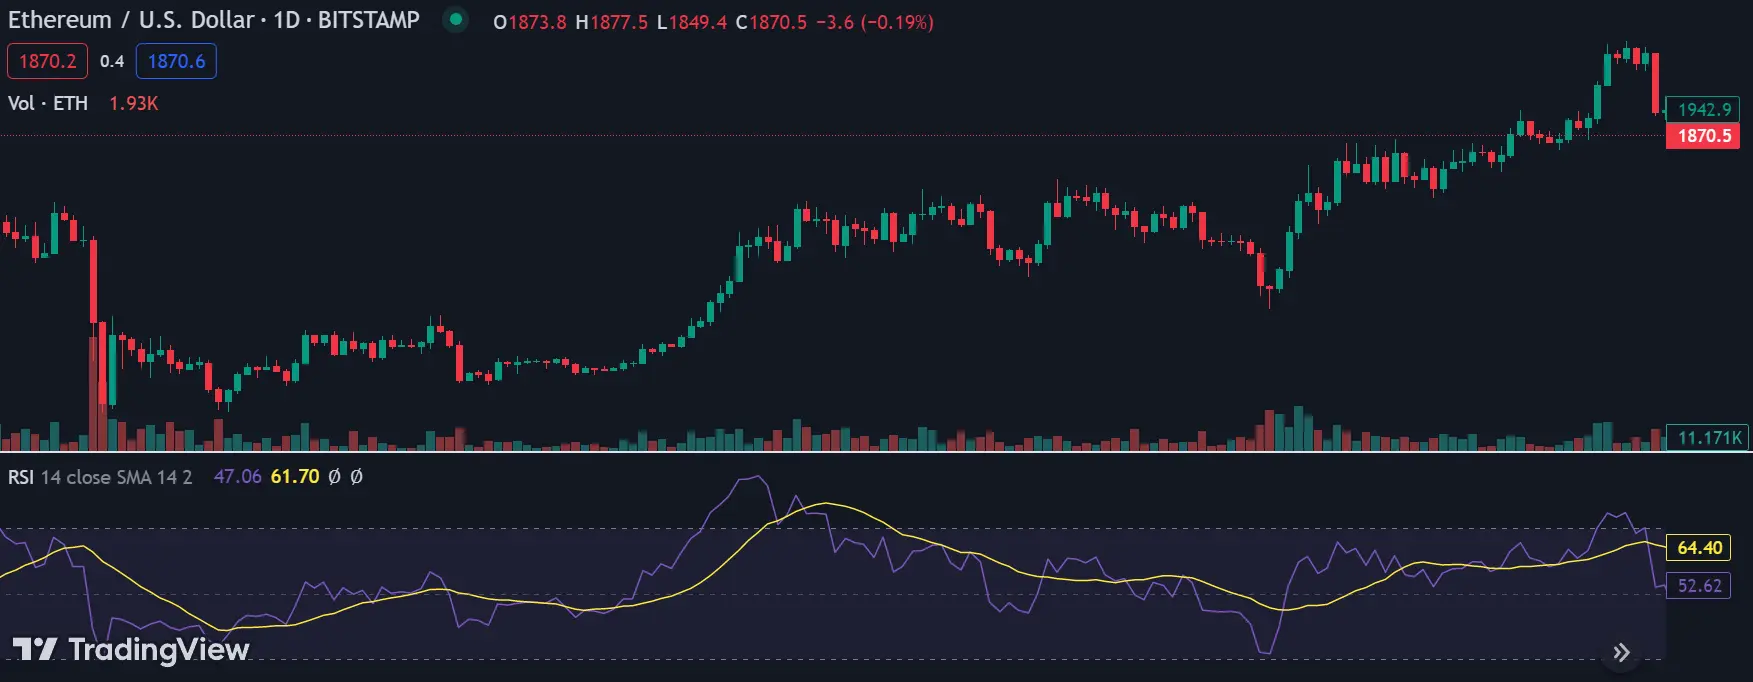
By default, the RSI measures the changes in an asset’s price over 14 periods (14 days on daily charts, 14 hours on hourly charts, and so on). The formula divides the average gain the price has had over that time by the average loss it has sustained and then plots data on a scale from 0 to 100.
When momentum increases and the price is rising, it indicates that the stock is being actively bought in the market. If momentum increases to the downside, it is a sign that the selling pressure is increasing.
The RSI is also an oscillating indicator that makes it easier for traders to spot overbought or oversold market conditions. It evaluates the asset price on a scale of 0 to 100, considering the 14 periods. While an RSI score of 30 or less suggests that the asset is probably close to its bottom (oversold), a measurement above 70 indicates that the asset price is probably near its high (overbought) for that period.
Modifying RSI Settings
Although the default settings for RSI is 14 periods, traders may choose to modify it in order to increase sensitivity (fewer periods) or decrease sensitivity (more periods). Therefore, a 7-day RSI is more sensitive to price movements than one that considers 21 days. Moreover, short-term trading setups may adjust the RSI indicator to consider 20 and 80 as oversold and overbought levels (instead of 30 and 70), so it is less likely to provide false signals. Æsir supports all RSI periods defined by TradingView so you can customise your algorithmic trading strategy to suit your trading style.
Using RSI based on Divergences
Besides the RSI scores of 30 and 70, which may suggest potentially oversold and overbought market conditions, traders also make use of the RSI to try and predict trend reversals or to spot support and resistance levels. Such an approach is based on the so-called bullish and bearish divergences.
A bullish divergence is a condition where the price and the RSI scores move in opposite directions. So, the RSI score rises and creates higher lows while the price falls, creating lower lows. This is called a “bullish” divergence and indicates that the buying force is getting stronger despite the price downtrend.
In contrast, bearish divergences may indicate that despite a rise in price, the market is losing momentum. Therefore, the RSI score drops and creates lower highs while the asset price increases and creates higher highs.
Closing Thoughts
There are several important factors to consider when using the Relative Strength Index indicator, such as the settings, the score (30 and 70), and the bullish/bearish divergences. However, one should always keep in mind that no technical indicator is 100% efficient - especially if it is used alone. Therefore, traders should consider using the RSI indicator along with other indicators in order to avoid false signals. This is especially true in algorithmic cryptocurrency trading.
We believe that the best way to learn about RSI, and the market in general is by doing. that’s why we’re one of the only algorithmic cryptocurrency trading platforms that offer FREE paper trading. Create your Æsir account to get started.