Using Hammer Candlestick Patterns in Algorithmic Cryptocurrency Trading
Tue May 16 2023
The hammer candlestick pattern, is a key tool in the arsenal of all traders, given its predictive value in assessing potential market reversals. Read more.
As a trader, whether you engage in manual trading or utilize a crypto trading bot platform such as Æsir, understanding chart patterns is an essential skill set. The hammer candlestick pattern is a powerful tool that many traders rely on due to its predictive value in determining potential market reversals. Being able to spot this pattern, understand its implications, and act upon it is an invaluable aspect of a trader’s strategy. This pattern is especially relevant in the volatile world of cryptocurrency trading, where sudden market shifts can occur frequently.
Candlestick patterns, such as the hammer pattern, can play an important role in creating robust algorithmic trading strategies. These patterns provide insights into market sentiment within a specific timeframe, signaling potential shifts from bullish to bearish trends and vice versa.
Understanding Candlesticks in Algorithmic Trading
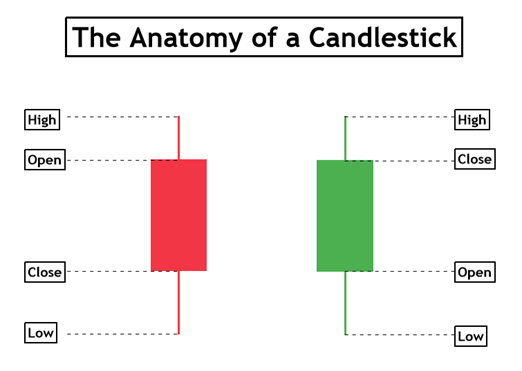
Every candlestick in a chart corresponds to a defined timeframe and displays an opening and closing price, forming the main body of the candlestick. The upper and lower wicks (or shadows) of the candlestick represent the highest and lowest prices within the specific period, providing valuable insights into price volatility and investor sentiment. Candlestick charts are more visually detailed than other chart types, like line or bar charts, offering a wealth of information at a glance.
The Anatomy of the Hammer Candlestick Pattern
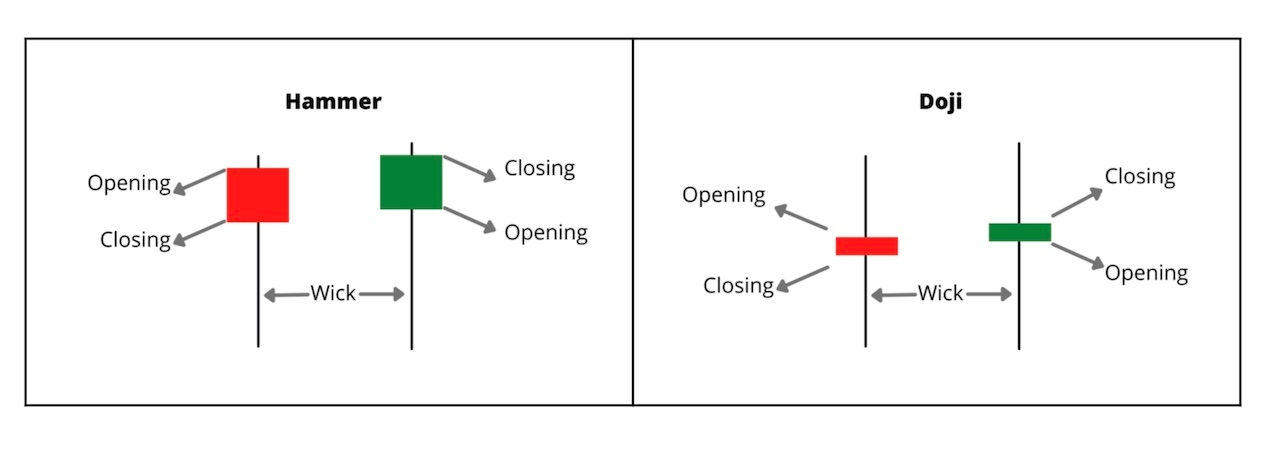
The hammer candlestick pattern forms when there’s a small body, accompanied by a long lower wick, at least twice the size of the body. This pattern’s distinguishing feature, the elongated lower shadow, encapsulates the struggle between sellers who drive the price down, and buyers who manage to rally and push the price back up above the opening mark. It is this significant recovery that suggests the market’s underlying bullish sentiment and potential for price reversal.
Identifying Bullish and Bearish Hammer Candles
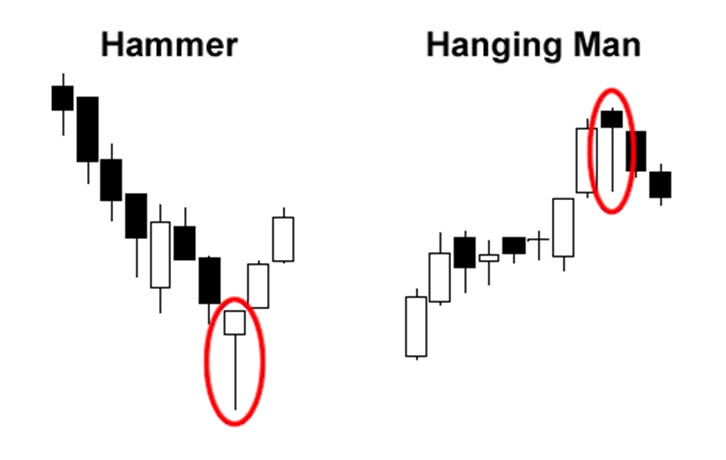
Bullish hammer candles, such as the hammer and the inverted hammer, usually appear following a downtrend in the market. These suggest the possibility of a trend reversal as bullish market participants regain control. Their bearish equivalents, the hanging man and the shooting star, usually emerge after an uptrend, hinting at the potential for a downward shift in the market.
The bullish hammer candle signifies that buyers have gained market control by the close of the trading period, as the closing price exceeds the opening price. In contrast, the bearish hammer, also known as the hanging man, indicates that sellers have applied pressure and forced the opening price to surpass the closing price, which could suggest a possible downside reversal.
Leveraging Hammer Candlestick Patterns for Potential Trend Reversals in Algorithmic Trading
In algorithmic trading, the occurrence of bullish hammer candles amid bearish trends can indicate a potential shift towards a bullish trend. Conversely, bearish hammer candles appearing after bullish trends could point to a potential shift towards a bearish trend. However, the validity of these reversal patterns heavily depends on their relative position to the preceding and succeeding candles. The wider market context ultimately dictates whether these reversal patterns are confirmed or dismissed.
Advantages and Disadvantages of Hammer Candlestick Patterns
While hammer patterns can provide critical signals for trend reversals, it is crucial to remember they are best used in combination with other trading strategies. Implementing these patterns in conjunction with other tools on your Æsir platform, such as moving averages, trendlines, RSI, MACD, and Fibonacci retracements, will likely yield more reliable results. Exclusive reliance on hammer patterns can lead to less consistent outcomes, emphasizing the importance of a diverse and well-rounded strategy that leverages multiple indicators and methods of analysis.
Hammer Candlestick Vs. Doji: Know the Difference
Though the hammer candlestick pattern and Doji may appear similar, they signify different market sentiments. While a hammer candlestick hints at a potential price reversal, a Doji --- a candlestick pattern that resembles a cross or plus sign due to its minimal or nonexistent body --- often signifies a state of market indecision, consolidation, or continuation. Doji candles are generally considered neutral, yet they can sometimes precede bullish or bearish trends depending on their context within a broader pattern.
Applying Hammer Candlestick Patterns in Algorithmic Trading
The hammer candlestick pattern can be integrated into algorithmic trading algorithms to identify potential buy or sell opportunities. For instance, an algorithm can be programmed to enter a long position when a bullish hammer candle forms after a sustained downtrend, given it suggests potential upward price momentum. Alternatively, an algorithm could be set to enter a short position when a bearish hanging man candle appears at the end of an uptrend, hinting at a possible downward price movement.
Utilizing Hammer Candlestick Patterns in Risk Management
In addition to spotting trend reversals, the hammer candlestick pattern can be used as part of a comprehensive risk management strategy. Traders could potentially set stop-loss orders below the low of the hammer candlestick in a bullish scenario, or above the high of the hanging man in a bearish scenario, to protect against unfavorable market movements. Additionally, profit targets could be set based on the length of the hammer candlestick, providing a data-driven method for realizing gains.
Concluding Remarks
The hammer candlestick pattern serves as a valuable tool in a trader’s repertoire, offering the ability to discern potential trend reversals. However, it’s crucial to note that these patterns should not be solely relied upon as definitive buy or sell signals. The effectiveness of hammer candlestick patterns is significantly amplified when used in conjunction with other analytical tools and technical indicators available in our algorithmic cryptocurrency trading platform, Æsir.
Lastly, proper risk management cannot be overstated, including the meticulous assessment of the risk-reward ratio of your trades and the strategic use of stop-loss orders to protect against significant losses during periods of high market volatility. In a market as dynamic as cryptocurrency, it’s the well-informed and strategically balanced approach that often leads to consistent success.