Understanding and Using the MACD Indicator in Algorithmic Cryptocurrency Trading
Sat Apr 22 2023
The Moving Average Convergence Divergence is a widely used technical indicator, popular in both manual and algorithmic trading. Here's how it works, and how you can use it to build your trading strategy.
The Moving Average Convergence Divergence (MACD) is a popular oscillator-type indicator used by traders for technical analysis (TA) in algorithmic cryptocurrency trading. Developed by Gerald Appel in the late 1970s, the MACD is a trend-following tool that uses moving averages to determine the momentum of a stock, cryptocurrency, or another tradeable asset.
Moving Averages and MACD
Before diving into the mechanisms of MACD, it is important to understand the concept of moving averages. Moving averages (MA) are simply lines that represent the average value of previous data during a predefined period. In financial markets, moving averages are among the most popular indicators for technical analysis and can be divided into two different types: simple moving averages (SMAs) and exponential moving averages (EMAs). While SMAs weight all data inputs equally, EMAs assign more importance to the most recent data values.
The MACD indicator is generated by subtracting two exponential moving averages (EMAs) to create the main line (MACD line), which is then used to calculate another EMA that represents the signal line. In addition, there is the MACD histogram, which is calculated based on the differences between those two lines. The histogram, along with the other two lines, fluctuates above and below a centerline, which is also known as the zero line.
How MACD Works
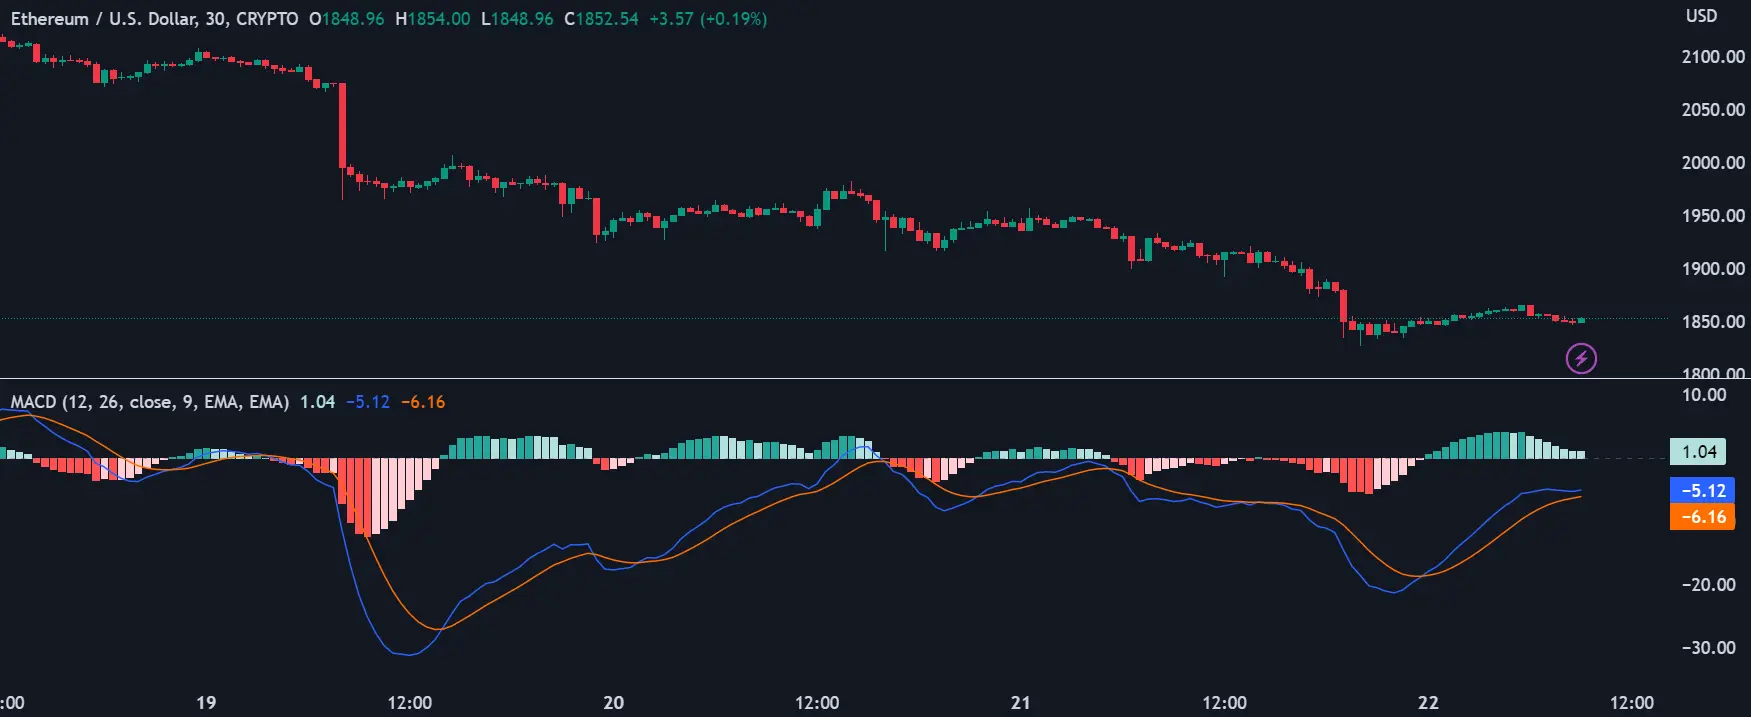
The MACD indicator consists of three elements moving around the zero line:
- The MACD line: helps determine upward or downward momentum (market trend). It is calculated by subtracting two exponential moving averages (EMA).
- The signal line: an EMA of the MACD line (usually 9-period EMA). The combined analysis of the signal line with the MACD line may be helpful in spotting potential reversals or entry and exit points.
- Histogram: a graphical representation of the divergence and convergence of the MACD line and the signal line. In other words, the histogram is calculated based on the differences between the two lines.
The MACD line is calculated by subtracting the 26-day EMA from the 12-day EMA. The signal line is calculated from a 9-day EMA of the main line and provides further insights into its previous movements. The histogram is calculated by subtracting the signal line from the MACD line.
MACD Settings and Interpretation
The default settings for MACD are based on the 12, 26, and 9-period EMAs - hence MACD (12, 26, 9). However, some technical analysts and chartists change the periods as a way to create a more sensitive indicator. It is worth noting that due to the high volatility of cryptocurrency markets, increasing the sensitivity of the MACD indicator may be risky because it will likely result in more false signals and misleading information.
The MACD indicator tracks the relationships between moving averages, and the correlation between the two lines can be described as either convergent or divergent. Relevant signals of the MACD indicator are related to the so-called crossovers, which happen when the MACD line crosses above or below the centerline (centerline crossovers), or above or below the signal line (signal line crossovers).
Both centerline and signal line crossovers may happen multiple times, producing many false and tricky signals - especially in regards to volatile assets, such as cryptocurrencies. Therefore, one should not rely on the MACD indicator alone. In algorithmic trading when you build a crypto trading bot that uses TA, you want to ensure that your signals are as accurate as they can be, so you should use other indicators to confirm what MACD is showing.
MACD and Price Divergences
Along with centerline and signal line crossovers, MACD charts may also provide insights through divergences between the MACD chart and the asset’s price action. For example, if the price action of a cryptocurrency makes a higher high while the MACD creates a lower high, we would have a bearish divergence, indicating that despite the price increase, the upside momentum (buying pressure) is not as strong as it was. Bearish divergences are usually interpreted as selling opportunities because they tend to precede price reversals.
On the contrary, if the MACD line forms two rising lows that align with two falling lows on the asset price, then this is considered a bullish divergence, suggesting that despite the price decrease, the buying pressure is stronger. Bullish divergences tend to precede price reversals, potentially indicating a short-term bottom (from a downtrend to an uptrend).
Conclusion
The MACD oscillator is a useful tool for algorithmic cryptocurrency trading. However, like most TA indicators, the MACD is not always accurate and may provide numerous false and misleading signals - especially in relation to volatile assets or during weak-trending or sideways price action. Consequently, many traders use MACD with other indicators to reduce risks and further confirm signals. With Æsir, you can easily create Algorithmic crypto trading strategies that use the MACD indicator, and test them for free using our Paper Trading mode.