Algorithmic Trading with Golden Cross and Death Cross Patterns
Sun Apr 30 2023
Golden Cross and Death cross strategies compare short and long term Moving averages to determine whether a trend reversal is likely to occur. They can be used in algorithmic cryptocurrency trading. Here's how to do that.
Algorithmic trading strategies in crypto as well as other asset classes often employ technical analysis, using various chart patterns to generate buy and sell signals. Among these patterns, the golden cross and the death cross stand out as useful tools for confirming long-term trend reversals. It is mostly used in long term swing trading, but could also be employed on lower timeframes, though might have to account for more volatility. In this article we’ll be exploring what golden cross and death cross are, and how to use them in an algorithmic crypto trading bot
Moving Averages and Their Importance in Trading Algorithms
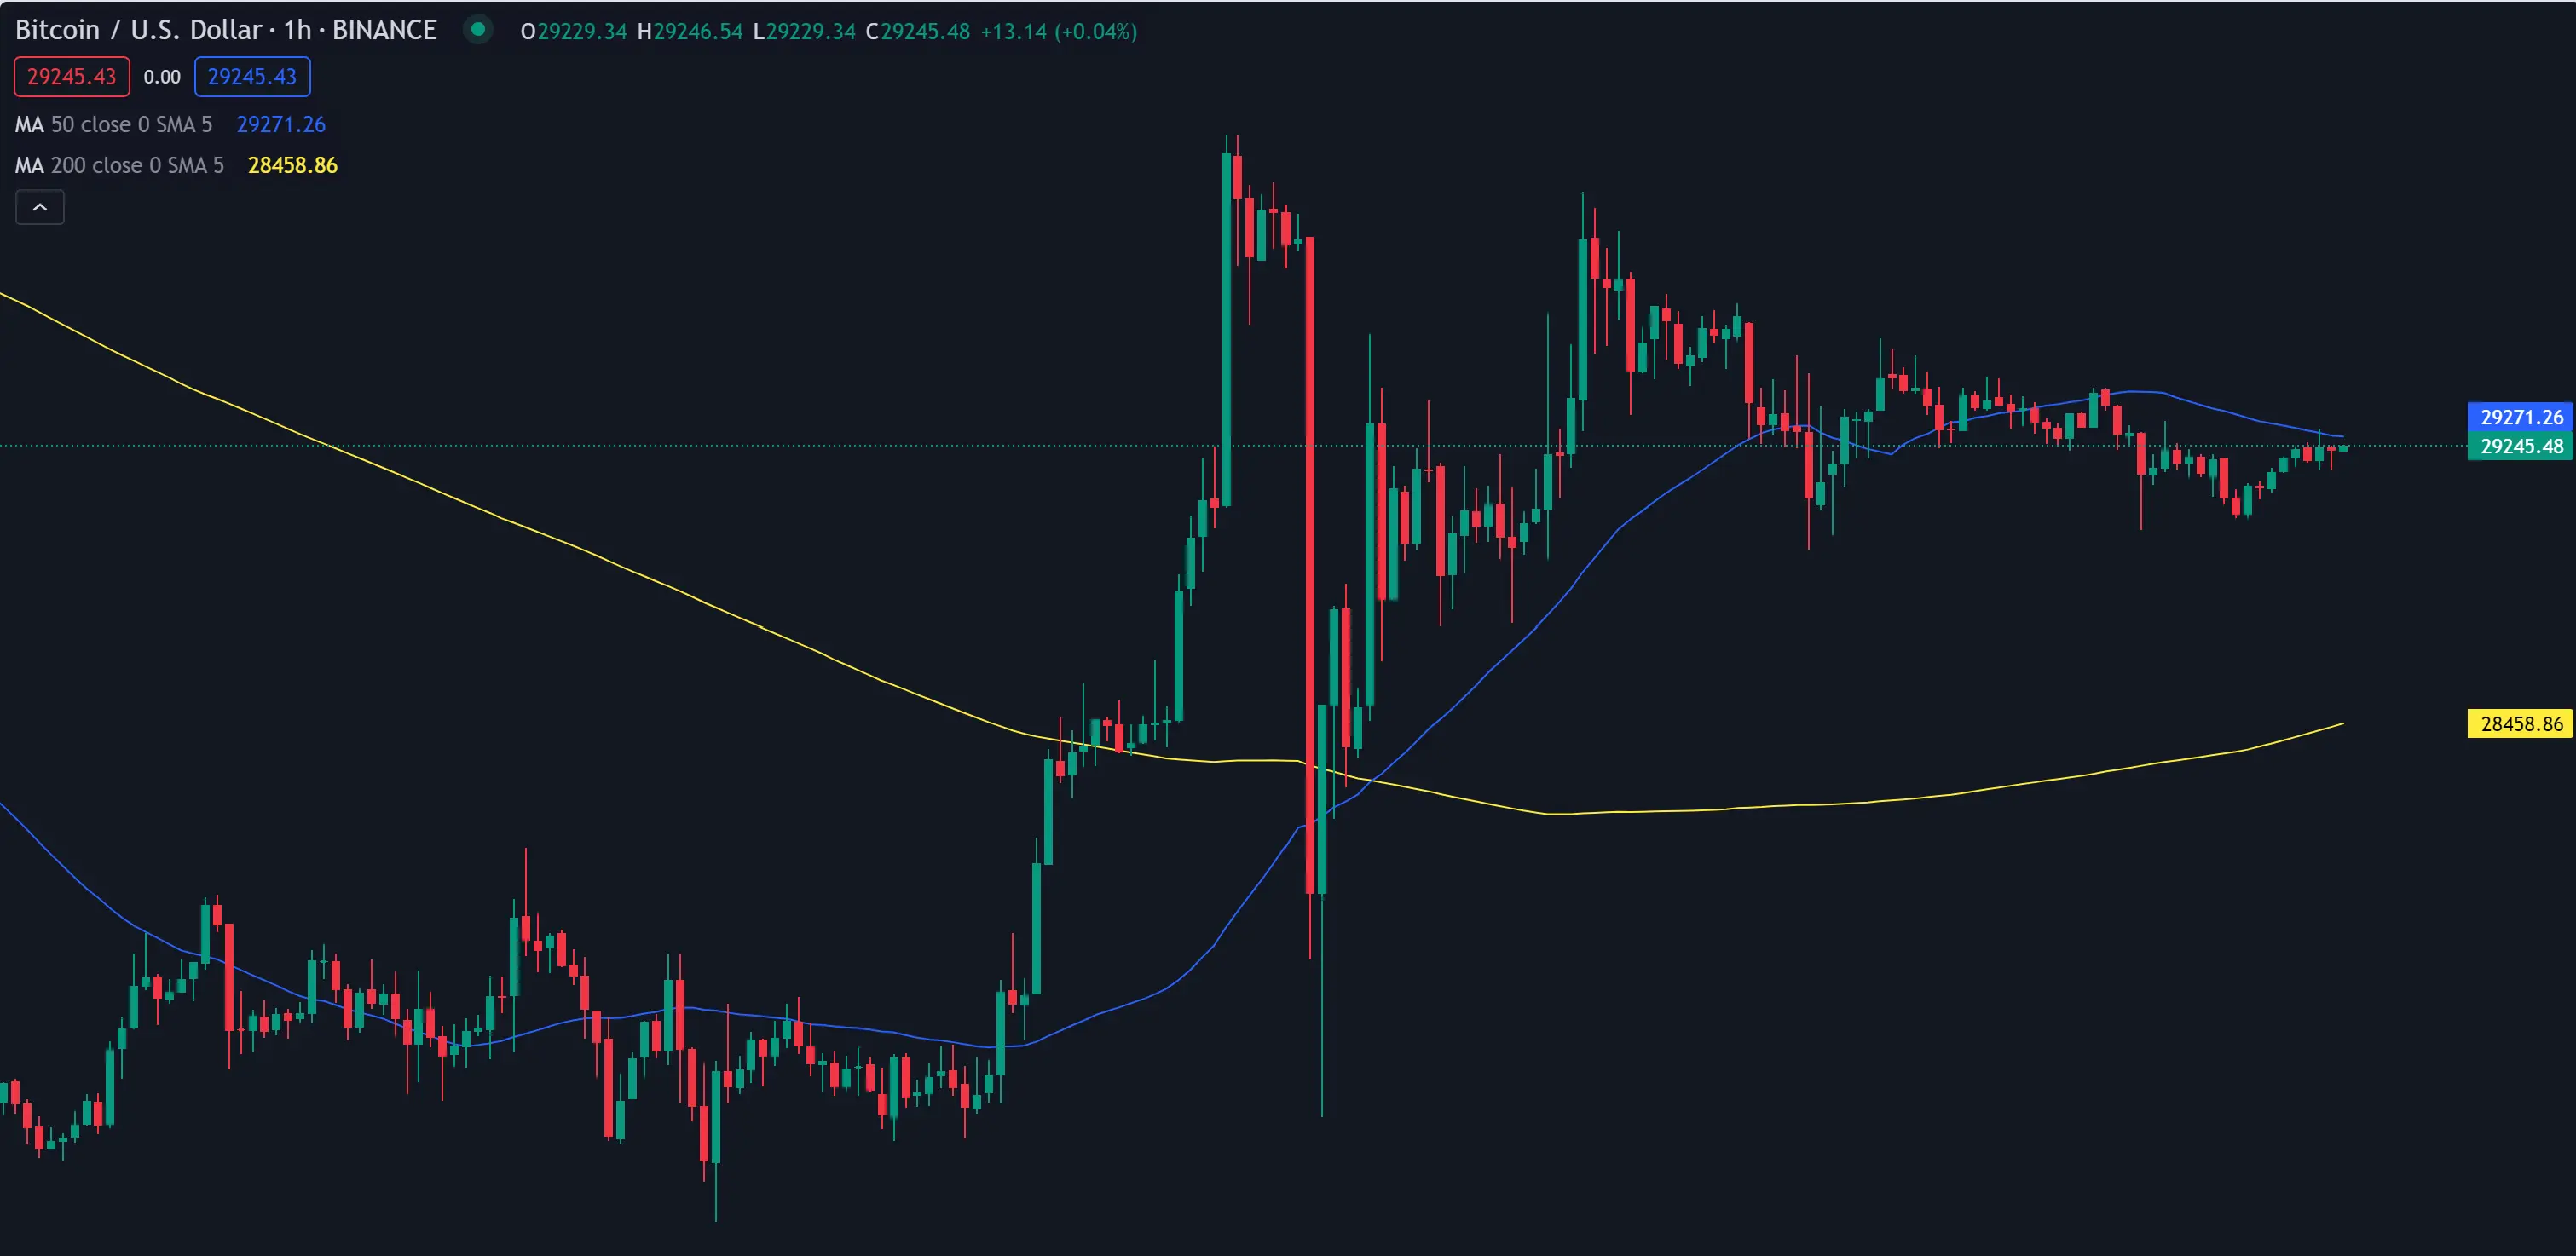
Before discussing the golden cross and death cross patterns, it is essential to understand moving averages (MAs). MAs are lines plotted over a price chart that measure an asset’s average price for a given time frame, such as a 200-day MA for the average price over the last 200 days. MAs are essential components in trading algorithms and play a vital role in identifying golden cross and death cross patterns.
When does the Golden Cross occur?
A golden cross occurs when a short-term moving average crosses above a long-term moving average, usually with the 50-day MA as the short-term and the 200-day MA as the long-term average. This pattern is typically considered a bullish signal and can be used as a buy signal in algorithmic trading.
To integrate the golden cross into an algorithmic trading strategy, the following steps can be taken:
- Monitor the short-term MA and the long-term MA to detect a crossover.
- Confirm the crossover with high trading volume and other technical indicators like MACD and RSI.
- Execute a buy order when the golden cross is confirmed and supported by other indicators.
On Æsir, our algorithmic cryptocurrency trading platform, you can easily build and test a golden cross strategy.
When does the Death Cross occur?
A death cross is the opposite of a golden cross and occurs when a short-term MA crosses below a long-term MA. This pattern is typically considered a bearish signal and can be used as a sell signal in algorithmic trading.
To integrate the death cross into an algorithmic trading strategy, the following steps can be taken:
- Monitor the short-term MA and the long-term MA to detect a crossover.
- Confirm the crossover with high trading volume and other technical indicators like MACD and RSI.
- Execute a sell order when the death cross is confirmed and supported by other indicators.
Improving Algorithmic Trading with Golden Cross and Death Cross Patterns
While golden crosses and death crosses can be powerful signals in algorithmic trading, it’s important to remember that they are lagging indicators with no predictive power. To improve the accuracy and effectiveness of these signals, consider the following:
- Analyze different time frames: Golden crosses and death crosses can occur on various time frames, with signals on higher time frames generally being more reliable than those on lower time frames.
- Use trading volume for confirmation: High trading volume can confirm the validity of a golden cross or a death cross signal.
- Incorporate other technical indicators: Using additional technical indicators such as MACD and RSI can help to confirm the context of a golden cross or death cross.
In conclusion, the golden cross and death cross patterns can be valuable tools in algorithmic trading for confirming long-term trend reversals. By incorporating these patterns into trading algorithms and using additional technical indicators for confirmation, traders can improve their strategies and increase the reliability of their buy and sell signals.