How to use Bollinger Bands in manual and algorithmic crypto trading
Fri Apr 28 2023
The Bollinger Bands (BB) indicator is a useful market tool for understanding asset volatility as well as overbought and oversold levels. It can also be used in Algorithmic cryptocurrency trading.
Bollinger Bands (BB) were devised in the early 1980s by financial analyst and trader John Bollinger. As an essential tool for technical analysis (TA), they serve as an oscillator measurer to signal high or low market volatility, as well as overbought or oversold conditions. BB can be effectively incorporated into algorithmic trading strategies for improved performance.
Integrating Bollinger Bands into Algorithmic Trading
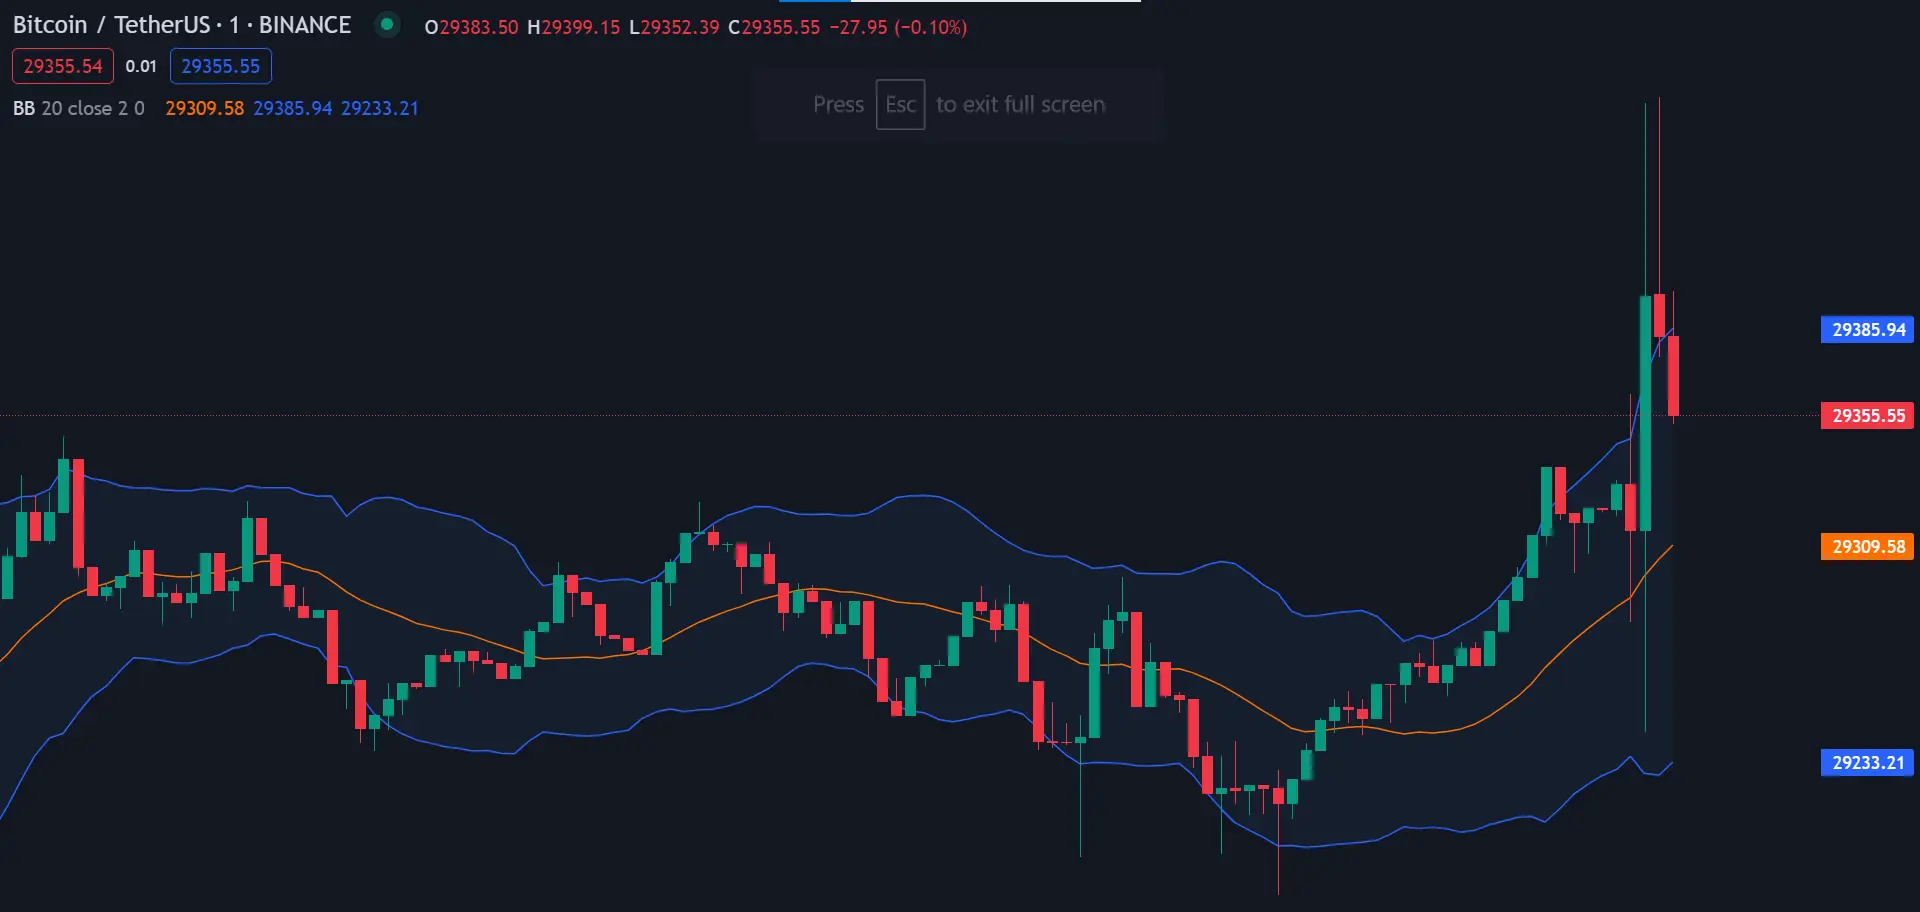
The BB indicator is structured to showcase price dispersion around an average value. Consisting of an upper band, a lower band, and a middle moving average line (also referred to as the middle band), the sidelong bands react to market price fluctuations. They expand with high volatility (moving away from the middle line) and contract with low volatility (moving towards the middle line).
Algorithmic trading strategies can utilize the standard Bollinger Bands formula, which sets the middle line as a 20-day simple moving average (SMA). Upper and lower bands are calculated based on market volatility relative to the SMA (referred to as standard deviation). However, settings may be adjusted according to specific needs and trading strategies.
For instance, if the price surpasses the moving average and exceeds the upper Bollinger band, it may signal an overextended (overbought) market. Conversely, if the price of an asset drops considerably and exceeds or repeatedly touches the lower band, the market may be oversold or have found strong support.
Incorporating BB into algorithmic trading strategies across various asset types, including cryptocurrency can assist in setting selling or buying targets, or simply offer an overview of previous overbought and oversold market conditions.
Anticipating High or Low Volatility with Bollinger Bands
Bollinger Bands can also be valuable in predicting moments of high or low volatility, as the bands either expand or contract in response to the asset’s price. This information can be used to inform short-term trading algorithms and anticipate potential market movements.
When bands are over-expanded, trading algorithms may interpret this as an impending consolidation period or trend reversal. Alternatively, when bands are too tight, it may indicate that the market is preparing for an explosive movement.
Low volatility and tight deviation levels typically precede significant, explosive movements, which often occur as volatility increases. This information can be utilized to inform trading algorithms and enhance their performance.
Bollinger Bands and Keltner Channels: Complementary Tools
When comparing Bollinger Bands to Keltner Channels (KC), the latter uses the Average True Range (ATR) to set the channel width around a 20-day EMA, making them typically tighter than BB. In some cases, the KC indicator may be more suitable for detecting trend reversals and overbought/oversold market conditions.
However, Bollinger Bands excel in representing market volatility, with more explicit expansion and contraction movements. By using standard deviations, BB is less likely to produce false signals, as its width is larger and harder to exceed.
Both tools can be valuable for short-term trading algorithms and may even be used together for more reliable signals.
In conclusion, Bollinger Bands are a versatile technical analysis tool that can enhance algorithmic trading strategies by helping to detect trends, anticipate high or low volatility, and set buying or selling targets. When combined with other TA indicators, Bollinger Bands can significantly improve the performance of algorithmic trading strategies in various financial markets, including cryptocurrencies.